Calendar
A month at a glance — results on past days, workload on future days, and a drill-down behind every date.
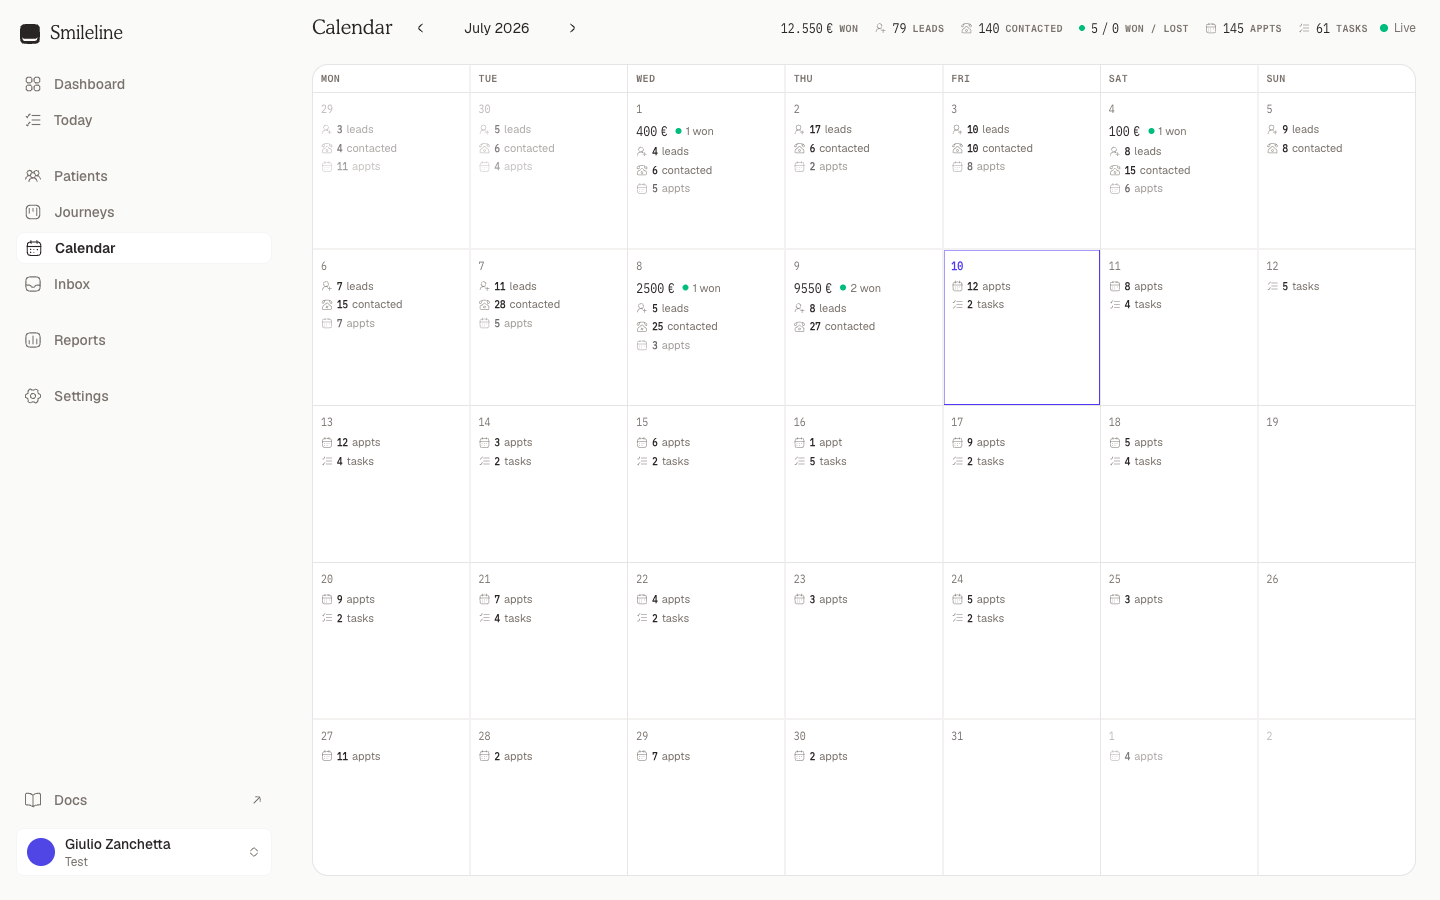
The Calendar shows your practice month as a grid you can read in seconds: what each past day produced, and what each future day holds. Use it to spot busy days ahead and to review how a day, a week or the whole month went.
Open Calendar from the sidebar.
Reading the grid
Each cell is one practice day (weeks start on Monday, times in your practice's timezone). What a cell shows depends on where it sits relative to today:
- Past days show results: treatment revenue that day, journeys going ahead and not proceeding, new leads, and how many leads were contacted.
- Future days show workload: appointments taking place and tasks due.
- Today (outlined) shows both.
Days with nothing recorded stay blank apart from the date, so the busy days stand out. Metric meanings:
| Metric | Counts |
|---|---|
| Treatment revenue | Deal value of journeys going ahead that day |
| going ahead / not proceeding | Journeys closed as going ahead or not proceeding that day |
| leads | New enquiries that came in that day — the same count as New leads on the Dashboard. A returning patient who enquires again counts; a patient record created without an enquiry (an import, say) doesn't |
| contacted | Distinct patients reached by an outbound touch that day |
| appts | Appointments taking place that day (cancelled ones excluded) |
| tasks | Open tasks due that day |
The header sums the visible month — the same numbers with the same icons, so it doubles as a legend.
Moving around
Use the arrow buttons next to the month name to step between months. When you're viewing a different month, a Today button appears to jump back to the current one.
The grid stays live: as leads arrive, tasks complete and journeys close, the numbers refresh on their own.
Open a day's detail
Click any day to see everything behind its numbers. The detail opens almost full screen, on a row of tabs — Overview, Schedule, Bookings, Leads, Journeys and Team. The list tabs show their row count, and a list tab only appears when it has something in it, so the strip doubles as a summary of what the day contains.
Overview
If you can open the Dashboard, the Overview is the Dashboard for that day. It shows the same cards with the same meanings:
- New leads, Bookings made, Lead → booked, Ad spend, Ad return and Response time. Each is compared with the day before, or, for a range of days, with the same number of days just before it.
- The Lead funnel, beside a card with the day's own facts: appointments, booked time, treatment revenue, and journeys going ahead and not proceeding.
- A New leads chart by hour, showing when the day's enquiries arrived, stacked by channel. For a range, the chart shows one bar per day, as the Dashboard does.
- The Team leaderboard, and the channel breakdown.
If your role can't open the Dashboard, the Overview shows the day's four cards and its breakdowns instead:
- Appointments — how many took place.
- Booked time — the chair time the day held, with the average appointment length beside it. Cancelled appointments released their slot and are left out; a no-show held its slot and is counted.
- New leads — how many arrived, with how many patients were contacted that day beside it.
- Treatment revenue — the value of journeys going ahead.
Each card carries a small badge comparing the day with the month you're looking at. New leads and revenue are compared with the month's days so far; appointments with every day of the month, since they're booked ahead. Below the cards, the breakdowns show:
- Appointment status
- Contacts by channel
- New leads by source
- Going ahead by treatment
Every breakdown counts the whole day, however many rows are behind it.
Leads
Leads lists every enquiry that came in that day, oldest first. The count matches the Dashboard's New leads. Each row shows the lead's source, name and arrival time, its treatment and one coloured status:
- Going ahead (with its value)
- Not proceeding
- Archived
- The lead's stage, such as Contacted or Consultation Booked, once someone has reached them (they answered, replied or booked). How long that first contact took is shown when you open the lead.
- Contact attempted (someone tried — a call with no answer or a message sent — but hasn't reached them yet)
- Not contacted (nobody has tried yet)
Once a lead has moved past Not contacted, its row also shows the first name of the team member who handled it — the lead's owner. Hover over it to see their full name. A lead nobody owns shows no name.
Click a lead to see its whole story on the right:
- Who they are. Their phone number, email, source and owner. Open record takes you to the patient.
- The journey. The treatment and value, how far along the pipeline the lead has moved, and when it came in, was first reached (or, if nobody has reached them yet, when someone first tried) and was closed as going ahead or not proceeding.
- Activity. The lead's full timeline, where you can add a note if your role lets you write them.
- The enquiry. What they submitted on the form or lead ad, and the source details of this enquiry: channel, campaign and ad identifiers.
On a phone, tap a lead to open it and Back to return to the list.
Team
Team shows what each person did that day. It appears if you can open the Dashboard's reports.
The list starts with Everyone, then each person who did something, busiest first, then teammates who can work leads but did nothing that day, marked No activity. Each row shows the person's total, a bar of their activity through the day hour by hour, and their calls, messages, emails and outcomes.
Click a row to see:
- Their counts of calls, messages, emails, outcomes, stage moves, notes and anything else.
- Their activity by hour.
- Everything they did, newest first. Each entry names the patient it was for and links to their record.
Everyone also shows who did each entry. Leads worked counts each lead once, the way the Dashboard leaderboard's Leads worked does. Automated sends and the AI agent aren't people, so they don't appear here.
Schedule
The Schedule tab draws the day as an hour-by-hour rail with each appointment as a block sized by its real length, coloured by status. A cancelled appointment gave its slot back, so it's drawn hollow with a dashed outline; a no-show held its slot and stays solid. Two blocks side by side means two appointments at the same time. Click a block to open that patient's record.
The rail spans from the first booking to the last. The tab is absent on a day with no bookings, and on a multi-day range — a merged range has no single day's clock to draw.
Bookings and Journeys
- Bookings lists every appointment with a status badge (Booked, Confirmed, Fulfilled, Cancelled, No-show, and so on) and its time.
- Journeys lists the journeys closed as going ahead or not proceeding, with their value.
Every row with a patient links straight to their record. Opening the calendar from a booking notification lands you on Bookings with that appointment highlighted.
Look at a range of days
To review more than one day at once, drag across the grid with the mouse, or click a day and then Shift-click another. The same dialog opens with the stats summed over the range and the lists merged in date order, each row labelled with its day. The Schedule tab is absent — a merged range has no single day's clock to draw.
Long lists show their first rows and a Load more button that keeps going until everything is listed. Leads loads 500 at a time, so a single day almost always fits without it. The cards and breakdowns always count the whole range.
A range can span up to 45 days. On a phone, the month renders as a tappable day list instead of a grid; tap a day to open its detail.
Request and track deposits
Send a deposit payment link mid-call, record cash payments, and handle refunds and no-shows.
Diary
The clinical workspace's day — a column per practitioner or room on an hour rail shaded by the rota, flags on each card for what needs doing, a date picker that shows how busy each day is, booking by click or drag or from any Book button with Find a time — one clinician or several together — a visit panel for arrivals, check-out and edits, answering online booking requests, a 3-day view, the List as the day's huddle, and Fill gaps, where the waiting list lives.